 HOME >
- Products >
- Spectrometer >
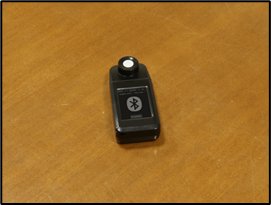
- Smartphone/tablet App for the C-4000 SEKONIC LD


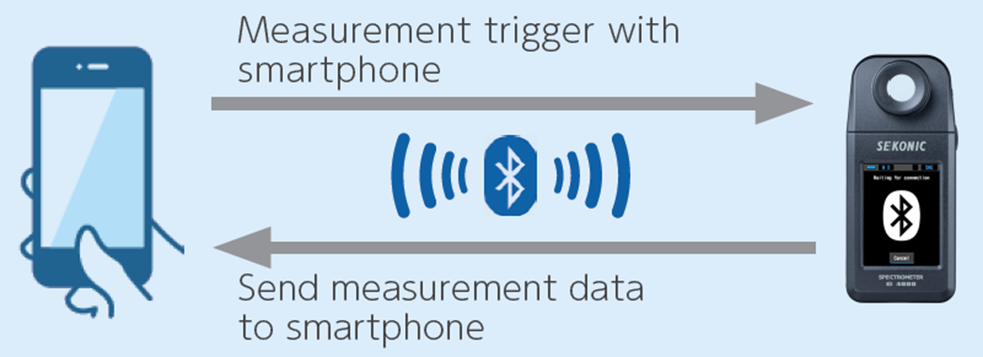
![]() Remote control further enhances the ease of use of the C-4000
Remote control further enhances the ease of use of the C-4000
[Basic functions (included version)]
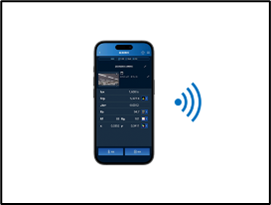
・Remote control of the C-4000 from a smartphone/tablet
・Import data from the C-4000 memory to a smartphone/tablet
・Various graph displays
・In-app data storage
・Status information display for the C-4000
・Supports 6 languages (English/German/French/Spanish/Italian/Japanese)
Remote control from the SEKONIC LD comes in handy in situations like this.
[Problems]
・Want to remotely control the meter so that my shadow does not affect the measured values
・Want to send a screenshot of the measurement results from my smartphone or tablet
・Want to measure hard-to-reach places such as low or high positions
[Solutions]
If you are concerned about the shadow of the person taking the measurement, you can solve the problem by triggering the C-4000 from a distance using the SEKONIC LD.
If you would like to share your measurement results, you can send a screenshot of the SEKONIC LD's measurement screen using your smartphone's communication function.
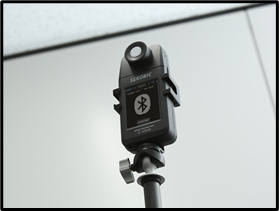
By using the C-4000 holder (under development) and a commercially available monopod, measurements in hard-to-reach places become more convenient.
* Be careful not to swing the C-4000 or hit it against the floor or wall.
![]() Various graph display
Various graph display
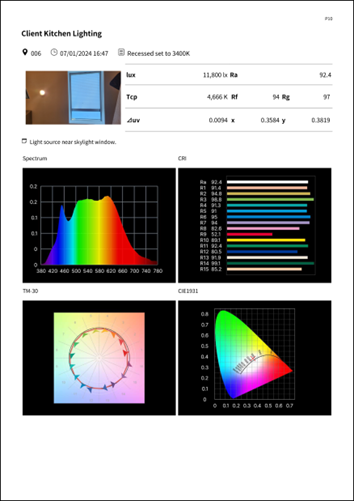
- Spectrum
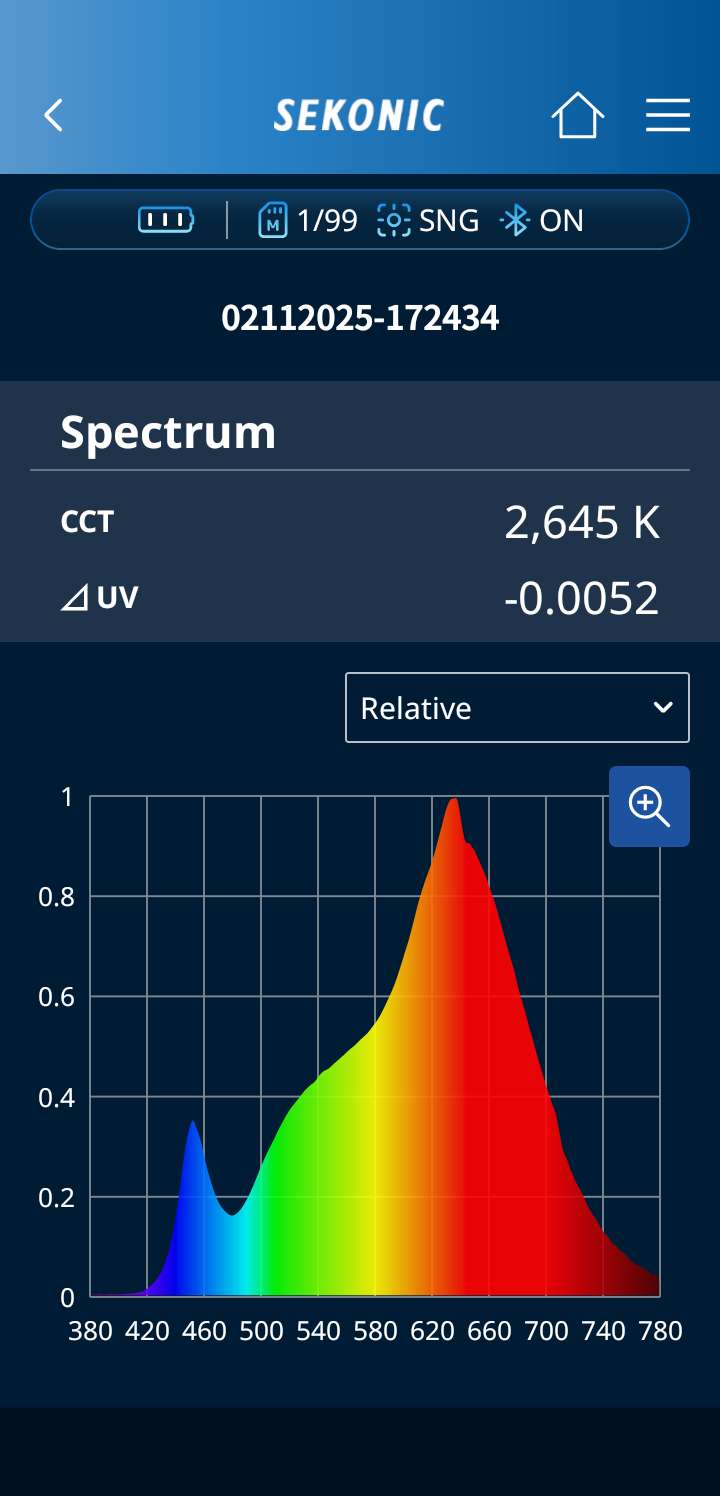
The Spectrum displays the spectral distribution of the measured light source in a graph with a percentage of relative intensity and the wavelength. The graph can be viewed and saved via the SEKONIC LD.
- CIE1931
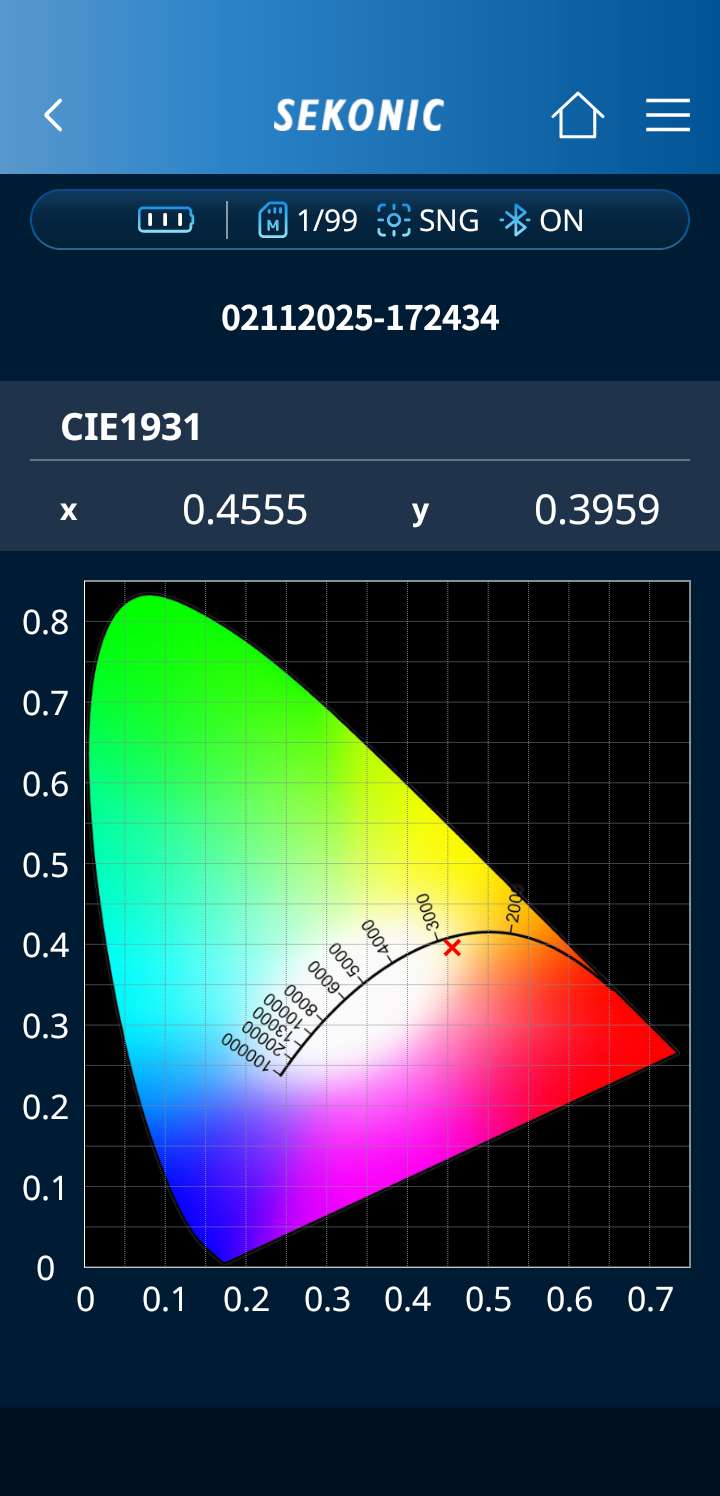
CIE 1931 color space is based on the tristimulus values mathematically derived from color measurements, representing red, blue, and green light and theoretically representing the standard observer’s eye. The values of CIE 1931 are denoted by x and y coordinates.
- CRI
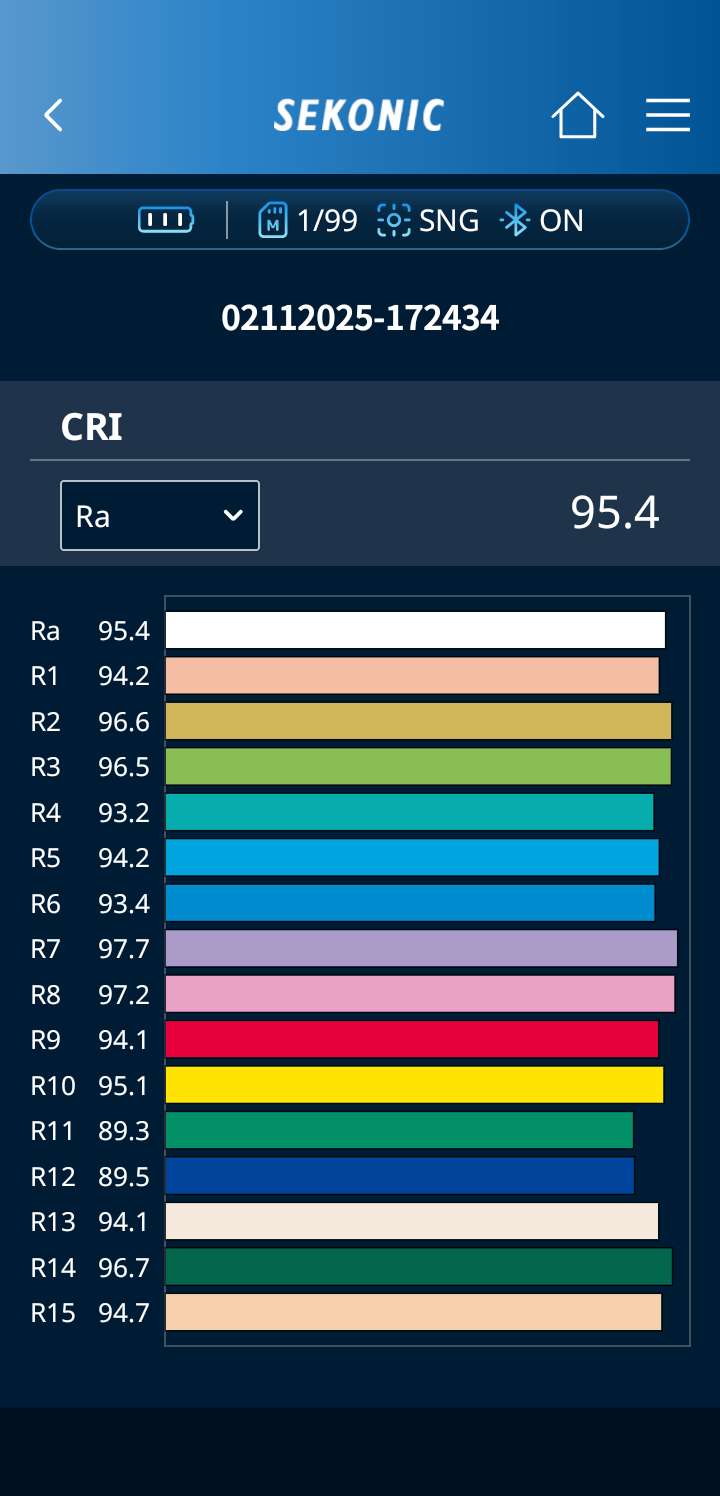
The Color Rendering Index (CRI) measures the ability of a light source to reveal the colors of objects in contrast to a natural light source, such as the sun. Ra averages R1 to R8 out of the 15 CRI values, providing a general assessment of the light sources’ color capabilities.
- TM-30-18
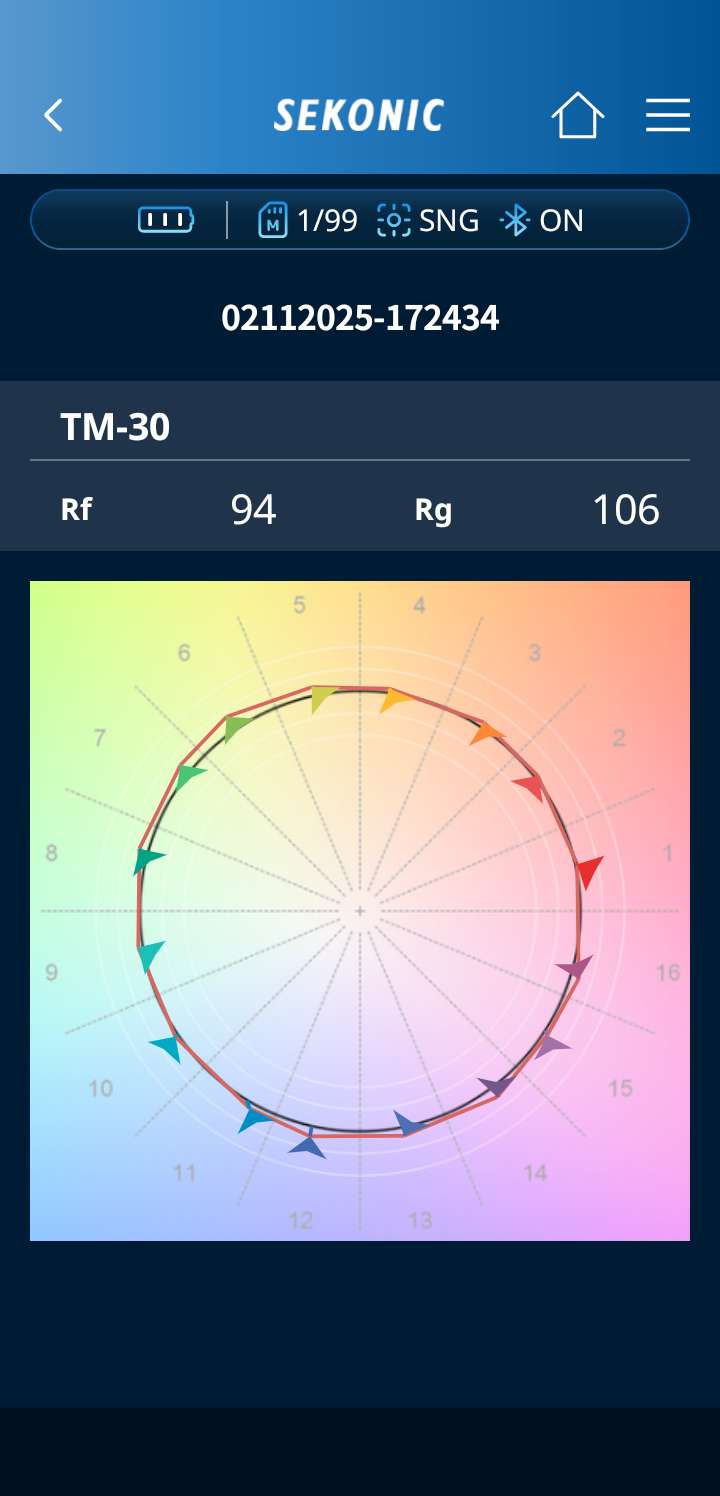
Published by IES (Illuminating Engineering Society), TM-30 is a color rendering index system that indicates how well a light source will reproduce a color accurately when it illuminates that object (as compared to a black body radiator – such as the sun).

![]() Measure, record, and report effortlessly with the all-in-one solution
Measure, record, and report effortlessly with the all-in-one solution
* Start up the paid app while there is a mobile phone signal or an internet connection via Wi-Fi.
[Traditional workflow]
-
One person takes measurements and reads out the measured values.
・It's a pain to read it out loud one by one.
・Risk of misspoken or misheard.
-
The other person writes the measurements on the drawing.
・It was common to measure more than 100 locations at a single site.
・Writing by hand was a hassle.
・Mistakes also occurred.
-
Entering handwritten measurements into a computer
・Risk of misreading or typo of measurement values.
・Input work was cumbersome.
- Create a reportThe report was finally completed after taking measurements in pairs at the site, inputting the measured values into a computer, and adjusting the appearance of the report.
[New workflow]
SEKONIC LD:
Measuring, recording,
reporting
・Done by one person easily
・Quick
・Accurate
[Advanced functions (in-app purchase)]
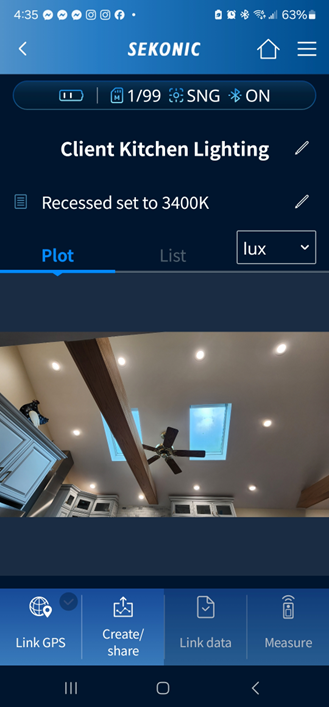
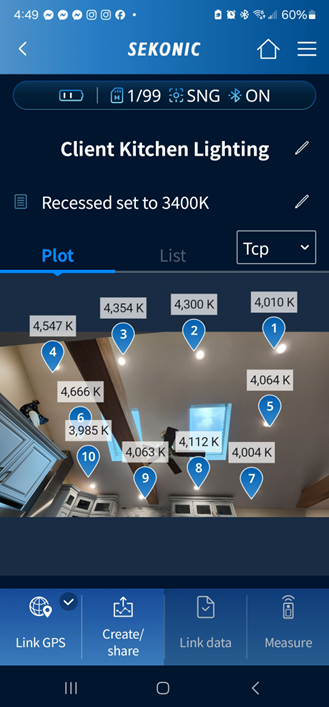
・Plotting measured values on drawing/photo
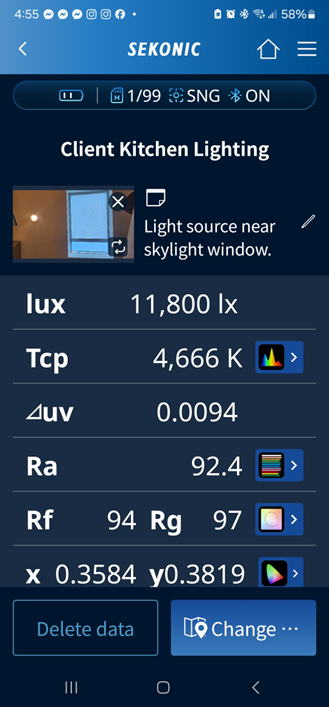
・Adding photo and memo to a measured value
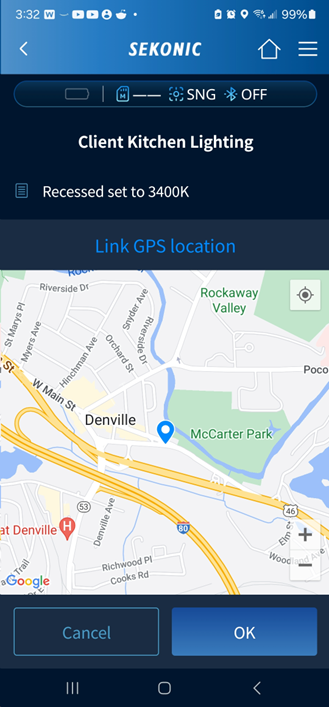
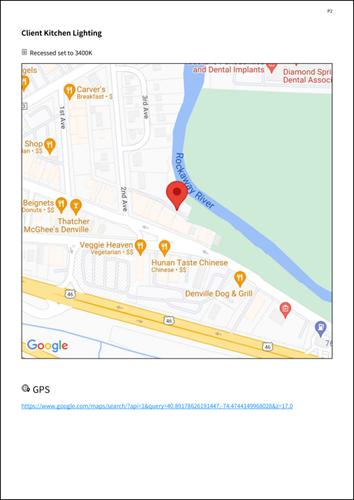
・Linking GPS location information
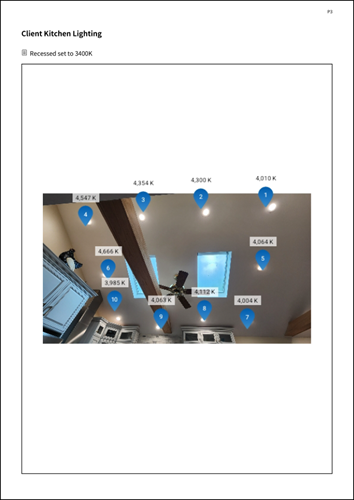
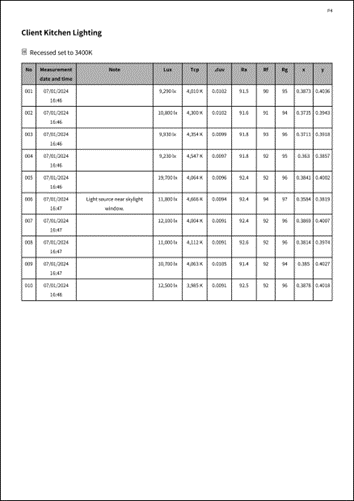
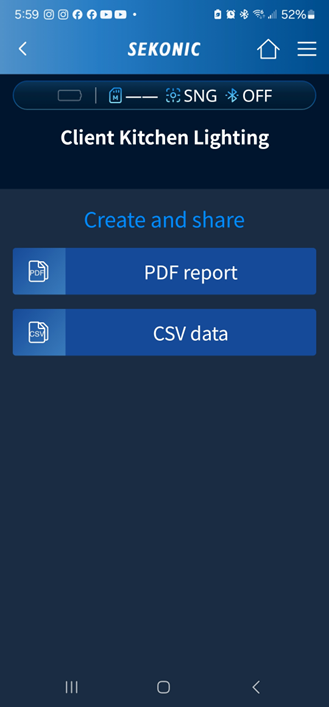
・Automatic report generation
・Share reports and measured values using the smartphone communication function
・Data management for each project
・Detailed settings such as selection of measurement items displayed on the drawing
![]() Workflow example on the SEKONIC LD
Workflow example on the SEKONIC LD


for iPhone/iPad
Compatible OS: iOS, iPadOS(compatible with major versions from the latest OS to the previous generation)
for Android
Compatible OS: Android OS(compatible with major versions from the latest OS up to 3 generations ago)
[Supported languages]
English, German, French, Spanish, Italian, JapaneseThe following devices are used for the evaluation of SEKONIC LD.
[Smartphone]
・iPhone SE (3rd generation)
・iPhone 15
・Galaxy S23 Ultra
・Galaxy A23 5G
[Tablet]
・12.9-inch iPad Pro 2022 (6th generation)
・iPad mini(2021)
・Galaxy Tab S9 FE

| Included version (Free download) |
Advanced version (In-app purchase) |
|
|---|---|---|
| Remote control of the C-4000 | Yes | Yes |
| Import data from the C-4000 memory | Yes | Yes |
| Graph displays (Spectrum/CIE 1931/CRI/TM-30-18) | Yes | Yes |
| In-app data storage | Yes | Yes |
| Status information display for the C-4000 | Yes | Yes |
| Support 6 languages (English/German/French/Spanish/Italian/Japanese) | Yes | Yes |
| Plotting measured values on drawing/photo | - | Yes |
| Adding photo and memo to a measured value | - | Yes |
| Linking GPS location information | - | Yes |
| Automatic report generation | - | Yes |
| Share reports and measured values using the smartphone communication function | - | Yes |
![]()